©bySandraMays
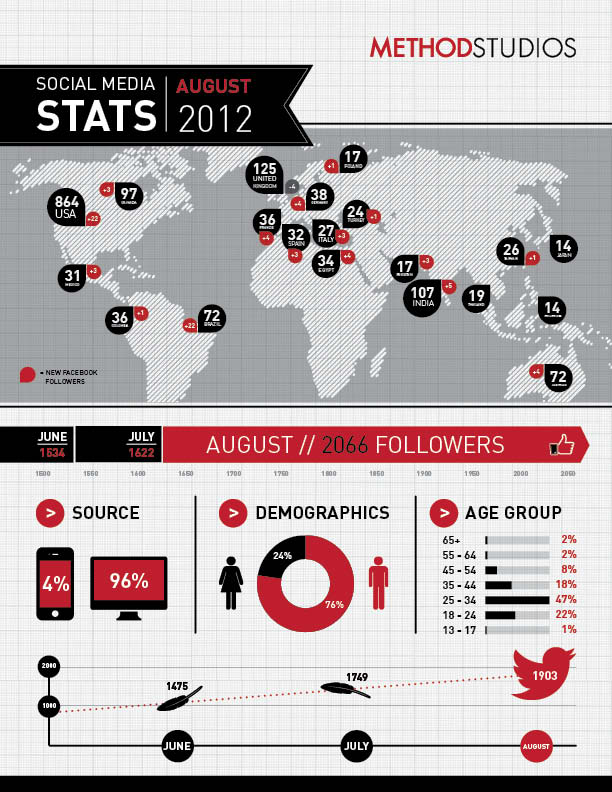
Today information graphics surround us in the media, in published works both pedestrian and scientific, in road signs and manuals. They illustrate information that would be unwieldy in text form, and act as a visual shorthand for everyday concepts. In newspapers, infographics are commonly used to show the weather, as well as maps and site plans for newsworthy events, and graphs for statistical data. If you are a visual person and like to convert boring data into fun graphical icons, I am talking to you…


No Comments